Facebook Insights – What do they tell you and how do they help you?
When Facebook announced its new format of timelines for official brand/company pages, it received both, positive and negative reactions to the changes. However, inspite of the mixed response to the look and feel, most users of the brand pages have found the new Facebook insights a lot more useful than the previous ones. Here’s a quick look at what each insight tells you and how you can use it to better your digital marketing strategy.
Friends of Fans – This metric indicates the unique number of individuals each person who has liked your page is friends with on a particular date. So it basically tells you the potential number of individuals you can reach through all the members who have liked your page on Facebook.
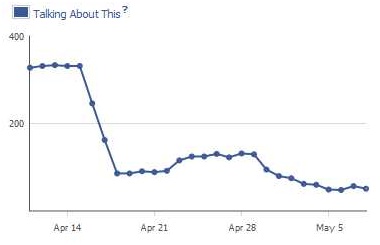
People Talking about this – This metric tells you how many unique individuals have created a story about your page in a particular time range. Creating a story includes the following:
- Liking the page
- Posting on the page wall
- Liking, commenting on or sharing a post
- Answering a question that you posted
- Mentioning the page
- Tagging the page in a photo
- Responding to your event
- Checking in at your place
- Recommending your place
You can use this metric to measure how many individuals you are able to reach over and above the number of individuals who have liked your page. It can help you determine, out of your total potential reach, what is the number you actually end up reaching. It can be one of the ways to judge the effectiveness of your social media marketing.
Weekly Total Reach – This metric tells you the total number of people who have seen content related to your page in a given time range. Content also includes ads and sponsored stories. This data can be analysed to identify patterns if any in the number of people reached by varying the presence or absence of ads or sponsored stories.
Reach – This metric tells you the number of people who saw content associated with your page in a specified time range.
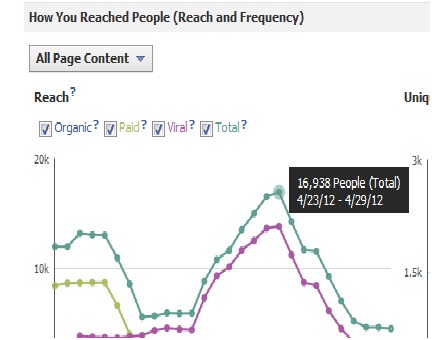
The basic difference between Weekly Total Reach and Reach is that while Weekly Total Reach gives you a weekly statistic, the Reach metric allows you to see how many people you reached on a particular day or a specific month or any time-range of your choice. This data can prove vital to find out the trends on interaction in terms of increase or decrease in traction on weekends, effect of festivals and holidays on traction for the posts, etc. Further digital marketing strategy can then be planned keeping these insights in frame.
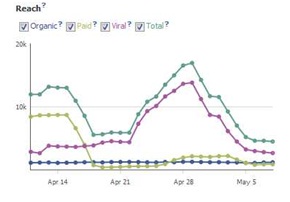
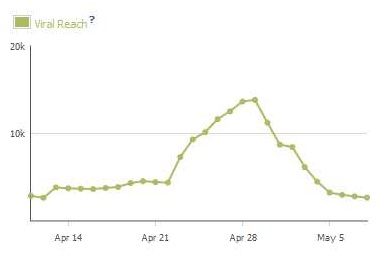
How You Reached People? – This metric gives you an insight into the ways in which members arrived on your page i.e. organic search, paid ads or viral. This is a very useful insight that can give you an idea as to how your digital marketing strategy needs to be modified in terms of search engine marketing, content, social media optimization, etc.
Check-ins – If the physical location of your business is a registered place online as well, this metric tells you the number of people who checked-in online while at your physical location. It can be used to judge the amount of offline traffic that is being driven by your online activities on social media.
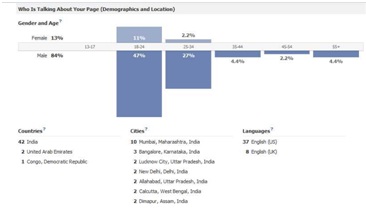
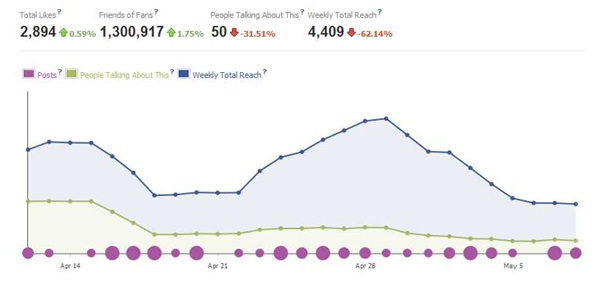
Chart Graphic – The chart graphic of the new Facebook insights captures a number of statistics in one single graph that is comprehensible and easy to understand. It is like a snapshot of the Facebook results that tells you the Total Likes, Friends of Fans, People Talking about This, Weekly Total Reach and the periodicity and frequency of your posts.
Post-Centric – The new Facebook Insights break down the quantitative reports according to posts. It allows administrators to review the response post-wise. This is very useful for determining a sound content strategy depending on the posts that receive maximum traction. The summary of responses can also be seen according to the type of post i.e. Wall, Photo, Link, Video, Platform Post, or Question. This again gives a better understanding on the kind of content that is likely to generate maximum response and shares from the members of the page.
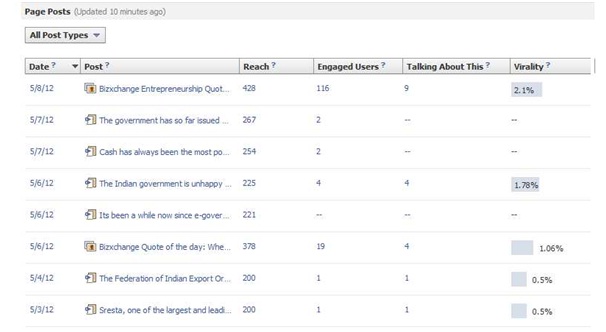
Engaged users – This metric gives you the number of people who have clicked on a particular post of your page that appeared in their news feed. As the shares and comments increase and the EdgeRank of the page gets higher, this number will steadily increase.
Virality – This metric tells you the percentage of people who built a story around a post on your page out of the total number of unique individuals who viewed the post. It can be used to judge the effectiveness of your digital marketing strategy and make the changes required in order to increase the interactions and virality of the posts on the page.
Administrators of Brand pages on Facebook can thus make the most of these insights to understand how exactly are customers interacting with them on Facebook, what works and what does not and use these vital inputs of information to plan a more sound and effective social media and digital marketing strategy for the future.
Marketer, Maven, Mentor. 3 Ms that define Siddharth Hegde, a.k.a. Sidd, Managing Director of the effervescent and ebullient Digital Marketing Agency, Ethinos. He tucks in over 18 years of sales & marketing experience under his belt, gathered from Fortune 500 and other inspiring companies that he has worked with. Sidd is a technology zealot since almost two decades, keenly tracking the interplay between technology, design, and usability across products and services. He brings to the table an industry understanding & background in digital strategy formulation & implementation. In his free time, he enjoys sailing, scuba diving, white water rafting, trekking, and seeking out the outdoors.


what do you think?